Hyperclip
This Python 3.5+ package implements volume computation of hypercubes clipped by hyperplanes. All methods implemented here have been proposed by Yunhi Cho and Seonhwa Kim (2020) in the article “Volume of Hypercubes Clipped by Hyperplanes and Combinatorial Identities.”. An arxiv paper is available here.
The source code is available on the Inria Gitlab instance.
Installation
Hyperclip is available through PyPI, and may be installed using pip:
$ pip install hyperclip
Introduction
The package is essentially composed by two classes : Hyperplane and Hyperclip.
Hyperplaneallows users to create a n-dimensional hyperplane defined as \(a.x + r \geq 0\). It is possible to directly set \(a\) and \(r\) or to provide \(n\) distinct points which belongs to the hyperplane, i.e \(a.x + r = 0\).Hyperclipallows users to create an hyperclip object. It aims to compute the volume of \(A.X+R \leq 0\) for \(X\) inside the uniform hypercube \([0,1]^n\). It is possible to directly set \(A\) and \(R\) or to set a list ofHyperplaneobjects.
Example code
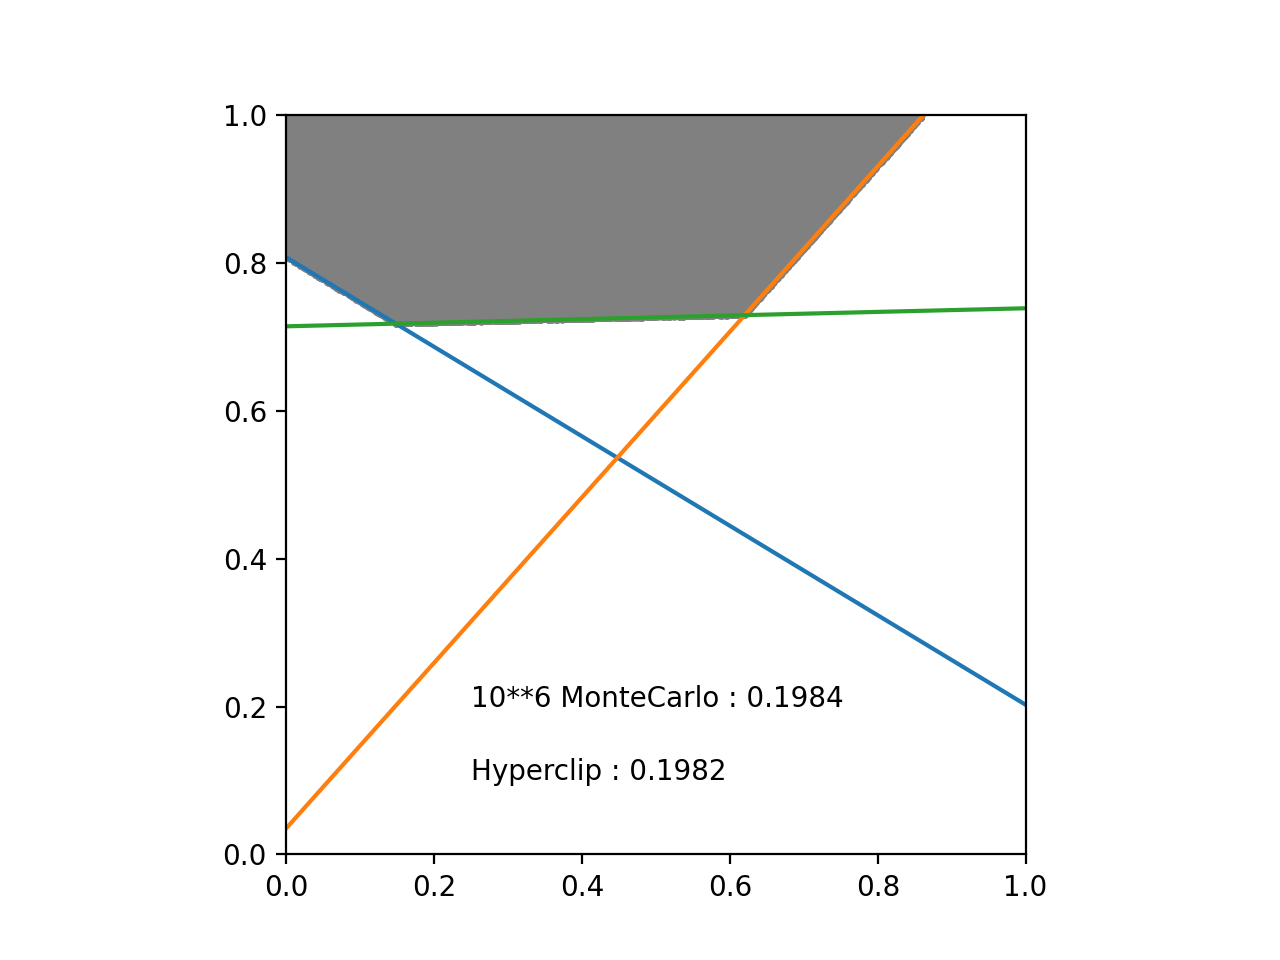
Here’s an example showing the usage of Hyperclip for a 2-dimensional case.
The result provided by Hyperclip is compared to a MonteCarlo volume estimation.
import numpy as np
import hyperclip
from matplotlib import pyplot as plt

n = 2
m = 3

np.random.seed(29)
hyperplanes = [hyperclip.Hyperplane().set_by_points(np.random.random((n,n))) for i_m in range(m)]
np.random.seed(None)

X = np.random.random((10**6,n))

id_pos_side = np.ones(X.shape[0])
for hyp in hyperplanes:
    id_pos_side = np.all((id_pos_side, hyp.side(X)), axis=0)

fig, axs = plt.subplots()
axs.set_aspect('equal', 'box')
plt.scatter(X[id_pos_side, 0], X[id_pos_side, 1], s=2, color='gray')

for hyp in hyperplanes:
    sol = hyp.compute_n_solutions()
    x_a, y_a, x_b, y_b = sol.flat

    a = (y_b-y_a)/(x_b-x_a)
    b = y_a - x_a * a

    y_0 = b
    y_1 = a * 1 + b

    plt.plot([0, 1], [y_0, y_1])

hc = hyperclip.Hyperclip().set_hyperplanes(hyperplanes)

vol = hc.volume()

plt.text(0.25,0.2, "10**6 MonteCarlo : "+str(round(id_pos_side.mean(),4)))
plt.text(0.25,0.1, "Hyperclip : "+str(round(vol,4)))

plt.xlim([0,1])
plt.ylim([0,1])
plt.show()